Tuesday, 31 March 2015

NS2 : Simulating Link Failure in Wired Networks


   In this post I have included the NS2 Script (TCL Script) for simulating link failure in wired networks. 

$ns rtmodel-at 1.0 down $n1 $n2
The code given above will fail the link between Node n1 and Node n2 at time 1.0.

$ns rtmodel-at 2.0 up $n1 $n2
The code given above will reconnect the link between Node n1 and Node n2 at time 2.0.

Executing the TCL Script

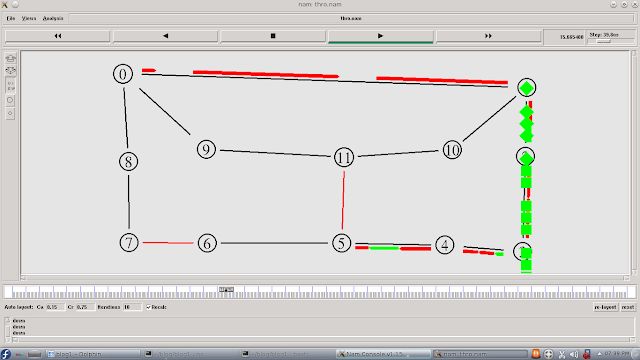
Simulated Network in NAM

Initial Traffic Flow Simulation in NAM

Link Between Node1 and Node2 Failed
 Traffic Flow through a Different Path

Link Between Node1 and Node2 is Up Again


NS2 : Xgraph Utility Example


   In this post I have included an NS2 Script (TCL Script) calling the Xgraph utility to plot the graph.

The Xgraph utility is called by the following line of code in the TCL Script,

exec xgraph out0.tr out1.tr out2.tr -geometry 800x400 &


The three files out0.tr, out1.tr and out2.tr contains the input data for Xgraph. To learn about the data format of Xgraph input files read my post Xgraph for plotting in NS-2.
Executing The TCL Script

NAM Window Showing the Simulated Network

NAM Showing Traffic Flow

Graph Plotted Using Xgraph


NS2 : Wireless Simulation 1


   In this post I have included the TCL Script for wireless simulation using NS2. Xgraph utility is used to plot the graph of Congestion Window VS Time.
Executing the TCL Script

NAM Window Showing the Nodes

NAM Window Showing the Traffic

Graph Plotted Using Xgraph


NS2 : Simulating a Network using RED Queue Management Algorithm


   In this post the NS2 Script (TCL Script) to simulate a wired network using RED (Random Early Discard) queue management algorithm is provided.

Executing the TCL Script

Topology in NAM Animator

NAM Showing Packet Drop


NS2 : Simulating a Network using Drop Tail Queue Management Algorithm


   This post contains NS2 Script (TCL Script) to simulate a wired network using Drop Tail queue management algorithm.

Executing the TCL Script
NAM Animator Showing the Topology
NAM Showing Data Transfer 
 

NS2 : Simulating Multicast in Wired Networks


      In this post I have added the NS2 Script (TCL Script) to simulate multicast in wired networks.   
Executing the TCL Script

Topology Shown in NAM

Data Transfer in NAM

Data Transfer in NAM


NS2 : Simulating a Network using SFQ Queue Management Algorithm


   In this post the NS2 Script (TCL Script) to simulate a wired network using SFQ (Stochastic Fairness Queuing) queue management algorithm is provided.
Executing the TCL Script

Topology in NAM

Data Transfer in NAM

   
Click here to download the NS2 Script.

NS2 : Simulating Distance Vector Routing


  The post provides the NS2 Script (Tcl Script) to simulate a wired network using Distance Vector Routing Protocol.
Execution of the Script
NAM Showing the Network Topology

Data Transfer in NAM

First Link Fails
Data Transfer through Alternate Path

Second Link Fails & Data Transfer through Alternate Path


NS2 : Simulating Link State Routing


  The post provides the NS2 Script (TCL Script) to simulate a wired network using Link State Routing Protocol.

Execution of the Script

Network Topology in NAM

Data Transfer & Link Failure

Data Transfer through Alternate Path
Second Link Fails & Data Transfer through Alternate Path

Xgraph for plotting in NS-2

After running your NS-2 program you will have a trace file as output.

Let us assume the name of the output file is "trace1.tr"

The trace file might look like below

+ 1             0 2 cbr 210 ------- 0 0.0 3.1 0 0
- 1              0 2 cbr 210 ------- 0 0.0 3.1 0 0
r  1.00212  0 2 cbr 210 ------- 0 0.0 3.1 0 0
+ 1.00212  0 2 cbr 210 ------- 0 0.0 3.1 0 0
+ 1.055      0 3 cbr 210 ------- 0 0.0 3.1 0 0

I am not explaining the meaning of the trace file. Instead I am giving instructions to use xgraph to draw a graph involving data extracted from the trace file.

To use xgraph we need 2 columns of data. The Unix command called "cut" is used for this purpose.

Open terminal and type the following commands

###############################

    cut  -d  " "  -f  2  trace1.tr  >  file1

    cut  -d  " "  -f  6  trace1.tr  >  file2

    paste      file1     file2    >   output

    xgraph   output

###############################

This will extract columns 2 and 6 and then draw a graph using the xgraph utility.

 
 for "cut" keyword -d specifies the delimiter between columns.
 Here the delimiter is white space ("  ").
 -f specifies the column number of the data to be extracted. 

Monday, 30 March 2015

NS2 Visual Trace Analyzer 0.2.72 Released

I’m posting the last version of NS2 Visual Trace Analyzer I’ve developed, 0.2.72.
It has many features: plots delay, jitter and throughput  graphics, calculates many statistics per node or per flow and it has a visual interface of the nodes disposition along the simulation.
The visual tool doesn’t show the packets exchange, I’ve not finished this feature, but it shows pretty well the nodes disposition, coverage and movement.
Application
You can download here: NS2 Visual Trace Analyzer 0.2.72
MD5: 4B07436896E5B6A21BB6F28963B5090F
SHA-1: EC27C104CAC244043F90384E3E0282019008681A
User Manual
You can download here: NS2 Visual Trace Analyzer Manual
MD5: 2497745A1B9EB84CC151E41E2873A248
SHA-1: A3AFF9F488539FD8690E73124050182171A765D3
Application Crashes Troubleshooting Manual
Disable nodes movements interpretation: Disable Nodes Movements Manual
MD5: F715E995133398840BF1E1F5F219A6D3
SHA-1: BC8E206D28720D1FFDFCFC1870AC3F4BF5154DAF
Hope you like it!

Method to analyse NS2 Trace file

Today I am going to show a simple perl code to analyze NS2 trace file as an example of AODV routing protocol. As you know when you run simulation, NS2 generates a trace file like sometrace.tr. It will give a lot of information about your simulation result. Not knowing how to analyze this file it is useless to run NS2 simulator. In this topic we will learn how to compute delivery ratio and message overhead.
First go to your home directory and create bin directory there. We will create trace file here so that we can access it from anywhere we want.
cd ~
mkdir bin
cd bin
Download analyze.pl file, which is attached to the post, to the bin directory. I will explain main points of the code. Following code opens a file to write simulation results.
$ofile="simulation_result.csv";
open OUT, ">$ofile" or die "$0 cannot open output file $ofile: $!";
Usually in trace file each line is started with some letter like r, s, D, N. Each of the letters has meaning. For detailed meaning of the letter refer to the NS Manual Page . And following perl code extracts lines which start with "s", which means sent packets. It maybe : control packets (AODV), data packets (cbr). We are only interested in packets those are sent by routers (RTR). If you enable MAC trace, the packets sent or received by MAC layer is also shown.
if (/^s/){
if (/^s.*AODV/) {
$aodvSent++;
if (/^s.*REQUEST/) {
$aodvSendRequest++;
}
elsif (/^s.*REPLY/) {
$aodvSendReply++;
}
}
elsif (/^s.*AGT/) {
$dataSent++;
}
}
REQUEST - AODV Route Request (RREQ) packets
REPLY - AODV Route Reply (RREP) packets;
AGT - Packets those are sent by agent such as cbr, udp, tcp;
And following code counts packet received by each function.
elsif (/^r/){
if (/^r.*AODV/) {
$aodvRecv++;
if (/^r.*REQUEST/) {
$aodvRecvRequest++;
}
elsif (/^r.*REPLY/) {
$aodvRecvReply++;
}
}
elsif (/^r.*AGT/) {
$dataRecv++;
}
}
Finally packets which are dropped are counted using following code :
elsif (/^D/) {
if (/^D.*AODV/) {
if (/^D.*REQUEST/) {
$aodvDropRequest++;
}
elsif (/^D.*REPLY/) {
$aodvDropReply++;
}
}
if (/^D.*RTR/) {
$routerDrop++;
}
}
Now we will analyze example file. In this post I have written about simulating WSN with AODV protocol, download it and do following. ( I am assuming you have already put analyze.pl file into your bin directory). Here is full source code to the analyze file : analyze.pl. More trace analyzer code is available in the this archive.
ns aodv_802_15_4.tcl
cat trace-aodv-802-15-4.tr | analyze.pl

Sunday, 29 March 2015

REVEALING SECRETS BEHIND COMMAND "MAKE" AND "MAKEFILE"

Friends,
We are decided to introduce a new segment in our blog named as "ToUr De Ns2" to get you more familiar with ns2 directories, folders and commands that we used in the ns2. We hope it gives you all a deep knowledge in ns2. We need all your supports and prayers. Comments and new ideas are welcomed.
Now we are going to have a deep look in command make. We all know that ns2 is a research tool. So all of the researchers are tried to customize files or to add new C++ modules in ns2 directory. During this time, it is necessary to recompile all the files that related or depend with it. So we need an effective command for recompilation of all files because manual recompilation is not possible. For that we here use a UNIX utility tool called as "make". This command has a significant role in development process. It keeps track of all the files created throughout the development process. By keeping track, it recompile the inter dependencies exist among these files; which may have been modified. The command syntax that we write in terminal to call is;
 make [-f filename]
Here make command recompiles the source code according to the descriptor file "filename" and the descriptor file is optional. So the command inside bracket is optional. By default the descriptor file is "Makefile". So if we not provided the filename, command automatically consider Makefile as descriptor file.

DESCRIPTOR FILE: MAKEFILE:

This file contains the name of source codes that have to execute, their inter dependency and how the file is to recompile. These things are specified using a specific dependency rule or by using a particular arrangement code names called as dependency rule. It contain three components; target,depfile&command
The syntax is given as;
<target1> [<target2> ...] : <depfile1> [<depfile2> ...]
<command1> [<command2> ...]
Here, the target file is the file which is needed to be compile and depfile are the files which are dependency file which is specified after semicolon(:) and also file inside bracket are optional ones. And the line below that shows the command that to regenerate the target file.
Example: 
# makefile of channel
OBJS = main.o
COM = cc
channel : ${OBJS}
${COM} -o channel ${OBJS}
main.o : main.c
${COM} -c main.c
clean :
rm ${OBJS}
Here, the target file is channel and that depends the file main.o and which is showed in third line and on the forth line the command showed to execute the recompiling. And the process repeats in the following lines. Final two line shows the clean function which is used to clean the dependency object file that are not neede after the recompilation. The UNIX command “cc -c file.c” compiles the file “file.c” and creates an object file “file.o,” while the command “cc -o file.o” links the object file “file.o” and create an executable file “file.”.

NS2 MAKEFILE:

Makefile in the ns2 is located in the ns2.xx directory and while we open it we can see the details of files needed to recompile. And in that file, we can mainly see the following keywords;

  • INCLUDES = : The files or items that seen inside this category is to be seen in ns2 environment.
  • OBJ_CC = & OBJ_STL = : It constitute the entire ns2 object files.
  • NS_TCL_LIB = : We have to add the Tcl files of  ns2.
If a new C++ module is developed, then its corresponding object file name with “.o” extension should be added in OBJ_CC and OBJ_STL and Tcl file name should be added NS_TCL_LIB.

If you created a new C++ module with corresponding files .cc,.h and .tcl (say new.cc,new.h and new.tcl) and also created a new folder new inside the ns2 directory. After this we have to to the following;
1. Include a string “-I./new” into the Line beginning with INCLUDES = in the “Makefile.”
2. Include a string “new/new.o” into the Line beginning with OBJ_CC = or OBJ_STL = in the “Makefile.”
3. Include a string “new/new.tcl” into the Line beginning with NS_TCL_LIB = in the “Makefile.”
4. Run “make” from the terminal.
After running “make,” an executable file “ns” is created and this file “ns” to run simulation.

Continue with a new topic in following posts......!!!!
Thank You.
Have a Nice day.

Saturday, 28 March 2015

TCP flow vs UDP flow

# Experimention :- TCP flow vs UDP flow            
# Experimenter  :- Sivajothy Vanjikumaran                                                                             |

            
#Create a simulator object
set ns [new Simulator]
#Colors Define
$ns color 1 brown
$ns color 2 green
#Save throughput for the First tcp flow
set f1 [open tcp-tcp_Exp1.tr w]
#Save throughput for the Second tcp flow
set f2 [open tcp-udp_Exp2.tr w]
#Open the nam trace file
set nf [open tcp_udp_nam.nam w]
$ns namtrace-all $nf
#Create nodes
set n0 [$ns node]
set n1 [$ns node]
set n2 [$ns node]
set n3 [$ns node]
set n4 [$ns node]
set n5 [$ns node]
#Links between the nodes
$ns duplex-link $n0 $n2 1Mb 10ms DropTail
$ns duplex-link $n1 $n2 1Mb 10ms DropTail
$ns duplex-link $n3 $n4 1Mb 10ms DropTail
$ns duplex-link $n3 $n5 1Mb 10ms DropTail
# Making a bottle neck connection
$ns duplex-link $n2 $n3 1Mb 10ms DropTail
#
#(0)-             -(4)
#     \         /
#    (2)-----(3)
#     /         \
#(1)-            -(5)
#
#layout of the data transferring path
$ns duplex-link-op $n0 $n2 orient right-down
$ns duplex-link-op $n1 $n2 orient right-up
$ns duplex-link-op $n2 $n3 orient right
$ns duplex-link-op $n3 $n4 orient right-up
$ns duplex-link-op $n3 $n5 orient right-down
#Queue limit between node n2 & n3 (Bottle neck)
$ns queue-limit $n2 $n3 25
#Creation of TCP agent and attach it to node n0
set tcp [new Agent/TCP]
$ns attach-agent $n0 $tcp
# Max bound on window size
$tcp set window_ 10
# Set flow ID field
$tcp set fid_ 1
#Creation of a UDP agent and attach it to node n1
set udp [new Agent/UDP]
$ns attach-agent $n1 $udp
# max bound on window size
$udp set window_ 10
# set flow ID field
$udp set fid_ 2
#Creation of TCP sinks agents 
set sink1 [new Agent/TCPSink]
#Creation of UDP Reciver Agent
set sink2 [new Agent/LossMonitor]
#Attach Sinks to nodes
$ns attach-agent $n4 $sink1
$ns attach-agent $n5 $sink2
$ns connect $tcp $sink1
$ns connect $udp $sink2
#Creation of FTP applications + attach to agents
set ftp [new Application/FTP]
$ftp attach-agent $tcp
#Setup a CBR over UDP connection
set cbr [new Application/Traffic/CBR]
$cbr attach-agent $udp
$cbr set type_ CBR
$cbr set packet_size_ 1000
$cbr set rate_ 1mb
$cbr set random_ false
#Define a 'finish' procedure
proc finish {} {
 global ns
 $ns flush-trace
 puts "running nam..."
 exec nam -a tcp_udp_nam.nam &
 exec xgraph tcp-tcp_Exp1.tr tcp-udp_Exp2.tr -geometry 800x400+10+10 -x "Time -ms" -y "Throughtput -Kbps" -t "Vanjikumaran's TCP-UDP Experiment" & 
 exit 0
}
proc record {} {
 global sink1 sink2 ns f1 f2
 #Set the time the procedure should be called again
 set time 0.1
 set bw0 [$sink1 set bytes_]
 set bw1 [$sink2 set bytes_]
 #Get the current time
 set now [$ns now]
 # throughtput in Kbps
 puts $f1 "$now [expr ($bw0 * 8) / ($time * 1024)]"
 puts $f2 "$now [expr ($bw1 * 8) / ($time * 1024)]"
 $sink1 set bytes_ 0
 $sink2 set bytes_ 0
 #Call procedure again
 $ns at [expr $now + $time] "record"
}
$ns at 0.0 "record"
$ns at 0.2 "$ftp start"
$ns at 0.4 "$cbr start"
$ns at 2.0 "$ftp stop"
$ns at 2.0 "$cbr stop"
$ns at 2.2 "finish"
$ns run
 
 you can run these codes using ns .tcl

Above NS2 scripts help you to simulate how TCP's functionality in the real network.

Lets see what has happened!

As shown in Figure 1, the network model was configured with two TCP 
(TransmissionControl Protocol) flows for two milliseconds and recorded 
observation in trace files.


Figure 1
Trace files were plotted using “xgraph” utility and it has been shown in figure 2
Figure 2
According to the results given by the experiment, TCP flows fairly shared the network bandwidth.

As shown in Figure 3, additional another experiment was conducted in respect to model the TCP flow and UDP (User Datagram Protocol) flow in shared network environment, which experiment was inspected for two milliseconds. Furthermore, observations were recorded in the trace file as previous experiment.
Figure 3 
Second experiment’s trace files were plotted using “xgraph” utility and it has been shown in Figure 4.

In accordance with the second experimental result given in the Figure 4, UPD flow was taken over the shared network resource from TCP flow and it did not moderately shared the band with it .
Figure 4

According to Figure 5, in first experiment; first TCP flow was shared the bandwidth with second TCP flow. In second experiment; TCP flow was trampled by UDP flow.Hence, as a conclusion of those two experiments, TCP Shares the network resource fairly.Nevertheless, UPD does not share the network resource.

Even though this is irrelevant to this topic, this help us to understand the behavior of the TCP connections.

TCP flow vs TCP flow using vegas

# Experimention :- TCP flow vs TCP flow            
# Experimenter  :- Sivajothy Vanjikumaran 
 
#Create a simulator object
set ns [new Simulator]
#Colors Define
$ns color 1 brown
$ns color 2 green
#Save throughput for the First tcp flow
set f1 [open tcp-tcp-one.tr w]
#Save throughput for the Second tcp flow
set f2 [open tcp-tcp-two.tr w]
#Open the nam trace file
set nf [open tcp-out.nam w]
$ns namtrace-all $nf
#Create nodes
set n0 [$ns node]
set n1 [$ns node]
set n2 [$ns node]
set n3 [$ns node]
set n4 [$ns node]
set n5 [$ns node]
#Links between the nodes
$ns duplex-link $n0 $n2 1Mb 10ms DropTail
$ns duplex-link $n1 $n2 1Mb 10ms DropTail
$ns duplex-link $n3 $n4 1Mb 10ms DropTail
$ns duplex-link $n3 $n5 1Mb 10ms DropTail
# Making a bottle neck connection
$ns duplex-link $n2 $n3 1Mb 10ms DropTail
#
#(0)-             -(4)
#     \         /
#    (2)-----(3)
#     /         \
#(1)-            -(5)
#
#layout of the data transferring path
$ns duplex-link-op $n0 $n2 orient right-down
$ns duplex-link-op $n1 $n2 orient right-up
$ns duplex-link-op $n2 $n3 orient right
$ns duplex-link-op $n3 $n4 orient right-up
$ns duplex-link-op $n3 $n5 orient right-down
#Queue limit between node n2 & n3 (Bottle neck)
$ns queue-limit $n2 $n3 10
#Creation of TCP 1 agent and attach it to node n0
set tcp1 [new Agent/TCP/Vegas]
$ns attach-agent $n0 $tcp1
# Max bound on window size
$tcp1 set window_ 20
# Set flow ID field
$tcp1 set fid_ 1
#Creation of a TCP 2 agent and attach it to node n1
set tcp2 [new Agent/TCP/Vegas]
$ns attach-agent $n1 $tcp2
# max bound on window size
$tcp2 set window_ 20
# set flow ID field
$tcp2 set fid_ 2
#Creation of TCP sinks agents 
set sink1 [new Agent/TCPSink]
set sink2 [new Agent/TCPSink]
#Attach Sinks to nodes
$ns attach-agent $n4 $sink1
$ns attach-agent $n5 $sink2
$ns connect $tcp1 $sink1
$ns connect $tcp2 $sink2
#Creation of FTP applications + attach to agents
set ftp1 [new Application/FTP]
$ftp1 attach-agent $tcp1
set ftp2 [new Application/FTP]
$ftp2 attach-agent $tcp2
#Define a 'finish' procedure
proc finish {} {
 global ns
 $ns flush-trace
 puts "running nam..."
 exec nam -a tcp-out.nam &
 exec xgraph tcp-tcp-one.tr tcp-tcp-two.tr -geometry 800x400+10+10 -x "Time -ms" -y "Throughtput -Kbps" -t "Vanjikumaran's TCP-TCP Experiment" & 
 exit 0
}
proc record {} {
 global sink1 sink2 ns f1 f2
 #Set the time the procedure should be called again
 set time 0.1
 set bw0 [$sink1 set bytes_]
 set bw1 [$sink2 set bytes_]
 #Get the current time
 set now [$ns now]
 # throughtput in Kbps
 puts $f1 "$now [expr ($bw0 * 8) / ($time * 1024)]"
 puts $f2 "$now [expr ($bw1 * 8) / ($time * 1024)]"
 $sink1 set bytes_ 0
 $sink2 set bytes_ 0
 #Call procedure again
 $ns at [expr $now + $time] "record"
}
$ns at 0.0 "record"
$ns at 0.2 "$ftp1 start"
$ns at 0.4 "$ftp2 start"
$ns at 2.0 "$ftp1 stop"
$ns at 2.0 "$ftp2 stop"
$ns at 2.2 "finish"
$ns run

Congestion Avoidance in TCP


  • Consequence of lack of congestion control
    • When a popular resource is shared without regulation the result is always over-utilization
    • With the introduction of TCP in 1983, users can write networking applications that require reliablity with greater ease
    • When more applications are available, more data and information are exchange on the Internet.
    • In mere 3 years time, the Internet had its first breakdown....
    • A classic paper by Jacobson contains the following introduction:
        "In October of '86, the Internet had the first of what became a series of congestion collapses. ..., the data throughput from LBL to UC Berkeley (sites separated by 400 yards and 2 IMP - i.e., routers - hops) dropped from 32 Kilo bits/sec to 40 bits/sec."
    • Jacobson's paper can be found here: click here
  • History of Congestion Control in TCP
    • There have been many (and increasingly sophisticated) congestion avoidance mechanims added to TCP since Jacobson's work on Congestion Control.
    • The Congestion Control mechanism in TCP is an ever developing process.... (it is still a research topic !)
    • The most popular versions of TCP - named after cities in Nevada - are:
        1. TCP Tahoe
          • This is the original version of TCP congestion control as implemented by Jacobson
          • Congestion detection mechanism is based on packet loss
          • Techniques used for congestion control:
            • Slow Start
            • Congestion Avoidance
            • Fast Retransmit
        2. TCP Reno
          • This is the most popular version of TCP congestion control mechanism today.
          • Techniques used for congestion control:
            • same as TCP Tahoe (Slow Start, Congestion Avoidance and Fast Retransmit), plus
            • Fast Recovery
        3. TCP Vegas
          • This is completely new implementation
          • Congestion detection mechanism is based on end-to-end delay


  • TCP packet size
    • TCP is a byte oriented protocol
    • However, TCP would not send every byte in a separate packet since this would result in an enormous overhead...
    • User data is carried inside a TCP packet which itself is carried inside a IP packet :

    • Example:
      • If no additional options are used (no additional packet header information beside the necessary ones), and each packet carries a single byte of data, the IP packet size will be 41 bytes.
      • The efficiency (useful part of the packet) would be 1/41 or 2.4%
      • That's equivelent to Uncle Sam taking 97.6% in income taxes !!!
    • TCP will always try to send multiple bytes in a packet to improve efficient


    • Since we are dealing with congestion control, we will assume the worst case scenario which is when the TCP source is transmitting a large amount of data continuously In other words:
        We assume that every TCP source is sending at maximum data rate This is achieved by sending packets whose size is as large as possible
        In other words, in the analysis of TCP congestion control scheme, we always assume that:

          TCP always transmits packets of size equal to MSS bytes


    • Maximum Packet (Segment) Size
      • User/System can impose a maximum packet size used in TCP
      • The maximum packet size is called Maximum Segment Size or MSS
    • The MSS will play an important part in describing the congestion avoidance mechanism used in TCP....


  • Transmission Data Rate
    • The transmission data rate is indirectly dependent on the transmit window size... The dependency is pretty complicated and very dynamic in nature
      The following examples will derive a simple relationship between the data transmission rate and the transmit window size.
    • Example 1:
      • Suppose the sender has a lot of data to transmit (transmits continously) and the transmit window size is equal to MSS (Max Segment Size). The following will happen:


        1. Because transmit window size is equal to MSS, the sender can send only 1 packet at a time and must stop (because he promised not to send more than MSS bytes before hearing back from the receiver on how the data were received).
        2. The ACK for will return in approximately RTT (round trip time) sec
        3. When the ACK returns, the sender sends the next packet. (If the ACK does not return for a long time, the sender will retransmit - sender assumes the packet was lost).
        4. The resulting transmission rate is approximately MSS/RTT bps.


    • Example 2: If window size = 2*MSS, the sender can send faster:

      But do not conclude that data rate is proportional to the window size. The above examples are "idealized". Network delays, route changes and other factors can make the relationship very unpredictable and dynamic.


  • TCP Transmit Window Size
    • Terminology:
        Transmit Window
          # packets (MSS bytes in each packet) that sender can transmit without having to wait for acknowledgement

    • The size of the Transmit Window is computed using 2 windows:
      1. Advertised Window Size
      2. TCP's Congestion Window Size

    • We have learned about the Advertised Window Size previously (see: click here ):
      • The advertised window size is the amount of data that the receiver is willing to buffer when data arrived out of order:


  • TCP's Congestion Window Size

    • An intuitive definition of the Congestion Window Size is:
        Congestion Window Size is
          the number of packets (of MSS bytes of data) that the sender believes that it can transmit into the network without causing congestion in the network.

    • Notice that this amount of data depends on the current network status and thus varies over time... In fact, it changes faster than the weather and it is just as unpredictable...


  • Relationship of the Transmit Window and the Congestion Window

    • When users send a large amount of data through the shared Internet, they must be be courteous in regard to:
      1. The receiving party (do not overwhelm a slower receiver)
      2. The shared transmission medium (Internet)
    • In other words, the sender must NOT transmit more data than:
      1. The receiver can handle
      2. The network links can handle
    • In yet other words:
        1. TCP Transmit Window size <= Advertised Window size,       and:
        2. TCP Transmit Window size <= Congestion Window size


  • Notations used in TCP congestion control scheme

    • Advertised Window Size (AWS) = amount of data that the receiver will buffer. AWS is negotiated at connection establishment and remains unchanged afterwards
    • Congestion Window Size (CWND) = window size imposed by the TCP congestion mechanism to avoid causing congestion in the network CWND changes over time !!!
    • Transmit Window Size (TWS) = the amount of unacknowledged data, i.e., data that TCP transmits in a burst without receiving any indication on what happened to the data.
    • Relationship:
         
          TWS = min (AWS, CWND)          


  • How TCP controls its transmission rate
    • Recall that the Advertised Window Size (AWS) is contained in the TCP header (so TCP has this information to its disposal)
    • The TCP congestion control algorithm will compute the value of CWND according to (implicit) signals/events (such as timeout, duplicate ACKs, see: click here ) from the network (We have not yet discussed HOW TCP changes the value of CWND - will come next)
    • From the values of AWS and CWND, TCP will computes the transmit window size as:
      • TWS = min (AWS, CWND)
    • Because AWS is not under TCP control (but determined by the receiver), we will leave this value out of the discussion. In the remainder of the discussion, we will discuss how TCP updates the value of CWND


  • TCP modes/phases of operation
    • The key to understand why TCP operates in the way it does is to remember that network condition changes constantly
      • New TCP connections can be started at any time which will reduce the avaliable network capacity for existing TCP connections
      • Existing TCP connections can end at any time which will increase the avaliable network capacity for the remaining TCP connections
    • To accomodate the uncertainty, TCP operates in two different modes/phases
      1. Slow Start Mode/Phase:
        • This is the start up mode of operation of TCP
        • In this mode/phase, TCP has an idea (guess) about the maximum transmission rate and TCP is trying to reach this transmission rate
        • Although TCP has an idea (guess) about this maximum transmission rate, TCP will NOT transmit at this rate instantaneously Rather, TCP will try to reach this maximum transmission rate in a piece meal fashion
        • In this phase, TCP will start by transmitting ONE packet and at each successfully transmission epoch, TCP will DOUBLE the number of packets (resulting in an exponential increase in number of packets in time).
      2. Congestion Avoidance Phase:
        • This is the phase that begins AFTER the start up phase The start up phase ends when TCP has reached the maximum transmission rate that it "believed" to be safe.
        • In other words, TCP is now in uncharted territory.... Because TCP has reach the maximum safe level, it would appear that there is still some more capacity available - it would be a shame NOT to use the available capacity !!!
        • But ! TCP has no idea what the new maximum capacity is... so it must be careful !
        • In this phase, TCP will increase the number of packet much slower than in the start up phase (increase rate will not be exponential, but linear)


  • TCP congestion strategy: A video game analogy
    • What TCP is doing is somewhat the same strategy as playing a video game...
    • In some adventure video games, there are "danger" areas where the player get killed by some booby trap.
    • So how do you play such a video game ?
        1. You just walked in a trap and get killed....
        2. Restart the game, and play quickly upto the point where you got killed.
        3. From that point on, play very carefully.....
    • The life of TCP is like a never-ending video game:
        1. When TCP detects congestion (through a packet loss), it sets CWND to half of the transmit window size that it was used when the packet loss occured. (Because the current transmit window size causes packet loss, half of the current transmit window size is a conservative estimate of the NEW safe level to operate !)
        2. Then TCP will restart by transmitting using CWND = 1 (ONE packet outstanding) and increase CWND exponentially (from ONE) to the new congestion window size CWND This phase is the slow start phase
        3. When TCP reach the new congestion window size (this is the point where TCP believe it is safe), it will enter the second phase and increase the window size much less aggressively (linearly instead of exponentially) This phase is the congestion avoidance phase
        4. The congestion avoidance phase ends when TCP detects a packet loss and the cycle starts again from the top....


  • Overview of the (idealized) TCP congestion control operation:

      1. When TCP starts out, it sets CWND = AWS (try to send as much data as the receiver can handle) If the network can handle this transmission rate, TCP will not need to do any congestion control !!! (Because the bottle neck is at the receiver...)
        The picture above shows a scenario where the network capacity is less than what the receiver can handle - i.e., the network is the bottle neck.
      2. At some point (in the figure, it happens when sender transmits 50 Kbps ), packets are dropped and congestion is detected. Because the packet drop happens at the moment when the sender was transmitting 50 Kbps , the new target congestion rate is set to 25 Kbps
      3. TCP increase the transmission rate exponentially until it reaches 25 Kbps
      4. From 25 Kbps onwards, TCP will increase the transmission rate linearly - until it discover a packet loss (In the figure, it happens when sender is transmitting 30 Kbps )
        Because the packet drop happens at the moment when the sender was transmitting 30 Kbps , the new target congestion rate is set to 15 Kbps
      5. TCP increase the transmission rate exponentially until it reaches 15 Kbps
      6. From 15 Kbps onwards, TCP will increase the transmission rate linearly - until it discover a packet loss And so on....

    • NOTES:
      • Remember: the goal of TCP is get the highest possible throughput.
      • This goal is not achieved by sending as fast as possible, but as much as the network can handle !!!
      • The available network bandwidth changes constantly.
      • TCP tries to determine the available capacity by remembering when the data rate at which a packet drop occured the last time and proceeds carefully starting from half way of this capacity level.
      • NOTE: the first time that TCP starts, it has no idea what the network capacity is and the only thing that it can do is to set the level to what the receiver can handle...


  • An overview of of techniques used in TCP Congestion control
    • We have just seen an high level discussion of the TCP Congestion control algorithm consisting of 2 different phase In the slow start phase, transmission rate increases exponentially in time.
      In the congestion avoidance phase, transmission rate increases linearly in time.
    • So basically, the difference between the 2 phases is the rate of increase in transmission speed.
    • Now it's time to see how the increase in transmission speed is realised.
    • TCP uses the following 3 mechanisms with very sexy sounding names:
      1. Slow Start
      2. Fast Retransmit
      3. Fast Recovery
    We will look at each mechanism separately and indicated when the mechanism is appropriate.

    The SLOW START Phase
  • The Slow Start Mechanism
    • During the slow start phase, TCP uses the slow start mechanism for congestion control.
    • Information needed to implement the slow start mechanism:
        • SSThresHold
            The window size that TCP believes to be safe
            • SSThresHold = AWS when TCP begins for the first time
            • SSThresHold is set to TWS/2 when TCP detects a packet loss
        • CWND
            The (current) congestion window size CWND and AWS will determine the transmit window size of TCP

    • Operation of the slow start mechanism is as follows:
        Initilization:
        • SSThresHold is set to AWS (when TCP first begins) or Transmit Window/2 (when TCP detects congestion)
        Slow Start:

        • Set CWND = MSS (i.e., ONE packet)
        • TCP increases CWND by MSS whenever TCP receives an NEW ACK packet (= an ACK message that TCP has never seen before) (NOTE:: If TCP receives a duplicate ACK, no updates are made to the CWND variable)

    • Example of TCP operation in the slow start phase:

      • Initially (at time 0), CWND = 1
      • At time RTT (round trip time), CWND = 2
      • At time 2 RTT, CWND = 4
      • At time 3 RTT (not in figure), CWND = 8
      • And so on...
      • When you plot CWND over time, CWND will increase exponentially

  • When to BEGIN a new Slow Start epoch
    • A slow start epoch can be initiated in 2 stituations:
        1. When a TCP connection is first establish. In this case, SSThresHold is set to AWS
        2. When TCP has detected a packet loss In this case, SSThresHold is set to Transmit Window/2
  • When to END a Slow Start epoch
    • The slow start epoch can ended by 2 events:
        1. When CWND > SSThresh
            This is a "normal" termination. In this case, TCP will enter the congestion control phase:

            TCP is now in "uncharted" territory and will increase its congestion window slower
        2. When TCP detects a packet loss
            This is an "abnormal" termination. In this case, TCP will re-enter
            TCP first sets SSThresHold = Transmit Window
            Then TCP resets CWND = 1 to start a new Slow Start epoch


  • A $64,000 question:
    • Why would TCP use a "slow start" procedure to increase CWND from ONE all the way to SSThrehHold Why not just set CWND to SSThrehHold and be done with it ???

    • Answer:
      • TCP uses timeouts to tell if packets are lossed
      • The timeout value used must be estimated because we don't know in advance how far away the receiver is located.
      • So TCP must maintain an estimate for the RTT to the receiver and the timeout interval is a function of the RTT
      • By sending packets slowly instead of in a burst, TCP can measure the RTT of packets more accurately

  • How can you call the EXPONENTIAL increase of transmission rate in "Slow Start" SLOW ???
    • The name "slow start" is probably one of the worst misnomer in networking...
    • How on earth can you call an exponential increase in window size SLOW ???
    • To understand the terminology, you have to look in history....
    • Prior to Jacobson's work, TCP operates as follows:


        1. A new TCP connection first negotiate a advertised window size (AWS)
        2. The source immediately transmits an amount of data that is equal to the advertised window size (e.g., when a large file is transfered).
    • Now, compared to sending AWS bytes of data, the new way of start transmitting ONE packet first is indeeds slower...

    The Congestion Avoidance Phase
  • TCP's Congestion Avoidance mode
    • TCP enters the congestion avoidance phase when the slow start phase terminates normally (i.e., CWND > SSThresHold)

    • Operation of the congestion avoidance phase is as follows:

        • Ideally, TCP increases CWND by ONE packet or MSS bytes after every RTT seconds It is quite complex to remember how many bytes you have acknowledge...
          It is far easier to increase CWND each time you receive a NEW acknowledgement
        • Notice that if TCP is transmitting maximum size packets, and the congestion window is CWND, then there are approximately CWND/MSS packets sent using the transmit window So if we add MSS/CWND to the congestion window size, we will have effectively increase CWND by ONE after all the acknowledgement packets return (they wil return in RTT seconds)
        • So practically, this can be (approximately) accomplished by increasing the congestion window CWND by MSS/CWND packets or MSS * MSS/CWND bytes after TCP receives a NEW acknowledgement So:

                CWND = CWND + MSS * MSS/CWND
             
          when TCP receive a NEW acknowledgement
          (Again, when a duplicate (old) ACK is received, CWND is not updated)

      Example of TCP operation in the congestion avoidance phase:

      • Suppose that CWND = 4 when TCP enters the congestion avoidance phase... TCP sends out 4 packets (each containing MSS bytes) to the receiver.
      • If there is no congestion, 4 NEW ACK packets will be received in approximately RTT seconds
      • When the first ACK packet is received, TCP updates CWND as follows:
            CWND = CWND + MSS * MSS/CWND        // CWND = 4 MSS  
                 = 4 MSS + MSS * MSS/(4 MSS)
                 = 4 MSS + MSS * 1/4
                 = 4.25 MSS
          

      • When the second ACK packet is received, TCP updates CWND as follows:
            CWND = CWND + MSS * MSS/CWND        // CWND = 4.25 MSS  
                 = 4.25 MSS + MSS * MSS/(4.25 MSS)
                 = 4.25 MSS + MSS * 1/4.25
                 = 4.485 MSS
          

      • When the third ACK packet is received, TCP updates CWND as follows:
            CWND = CWND + MSS * MSS/CWND        // CWND = 4.485 MSS  
                 = 4.485 MSS + MSS * MSS/(4.485 MSS)
                 = 4.485 MSS + MSS * 1/4.485
                 = 4.708 MSS
          

      • When the fourth (and final) ACK packet is received, TCP updates CWND as follows:
            CWND = CWND + MSS * MSS/CWND        // CWND = 4.708 MSS  
                 = 4.708 MSS + MSS * MSS/(4.708 MSS)
                 = 4.708 MSS + MSS * 1/4.708
                 = 4.92 MSS
          
      • So you can see that CWND is increased approximately by MSS or ONE packet after RTT seconds (In the slow start phase, CWND DOUBLES after each RTT seconds)


    • NOTE: the actual implementation of TCP (see Stevens - Volume 2) increases CWND during congestion avoidance slightly faster than above using to the following formula:
            CWND = CWND + MSS * MSS/CWND + MSS/8    


  • Why do TCP want to keep increasing CWND ?
    • Why does TCP not keep CWND constant after reaching the "safe" operation level SSThresHold ?
    • When TCP keeps increasing CWND, it would eventually cause a congestion !!! So why so foolish ???
    • The reason is:
      • TCP does not know the current network capacity... because network condition keeps changing.
      • The goal of TCP is to transfer data as fast as possible. If TCP would stop increasing CWND, it would not be true to its goal.
      • So during the congestion avoidance period, TCP is testing the tolerance of the network:
          after it has successfully transferring CWND amount of data, it adds one more packet to the congestion window: CWND + MSS and retest the network.
      (This technique is similar to kids testing their boundary by asking their parents for favors over and over again... The boundary may have moved :-))


  • When does the Congestion Avoidance phase BEGIN ?
    • When the Slow Start phase terminates successfully


  • When does the Congestion Avoidance phase END ?
    • Eventually, TCP will push the congestion window too far and cause some packet drop.
    • When a packet loss occurs, it can cause the sending TCP to timeout
    • When a timeout occurs, the congestion avoidance phase ends and TCP will begin a slow start phase:


      1. TCP sets SSThresh = CWND/2. This is the new "safe" operation level...
      2. Then TCP set CWND = 1 x MSS (i.e., 1 packet worth of data) and increases CWND at an expontial rate towards SSThresh (the "safe" level")

Fast Retransmit
  • Fast Retransmit
    • Before the introduction of the Fast Retransmit, TCP was not "pro-active".
    • Example:
        When packet 14 is lossed, and the receiver repeatedly transmits ACK 13 back to the sender, the sender would NOT act on this signal:


        1. Assume all packets upto packet 13 have been received and acknowledged
        2. When packet 14 is lossed, and packets #15, #16, #17 and #18 arrive out of order at the receiver, the receiving will send back ACK 13 to indicate that the last consecutive packet received was #13
        3. Prior to the introduction of Fast Retransmit, TCP does not act upon the multiple duplicate ACK messages from the receiver.
        4. The sender would TIMEOUT and them retransmits the lossed packet

      • FURTHERMORE, when TCP times out, TCP will enter the SLOW START phase


    • Fast Retransmit: using duplicate ACKs as indicators for lossed pacet

      • Clearly, when the receiver keep sending the same (duplicate) ACK, some message may be lossed
      • BUT, because packets can arrive OUT OF ORDER, an occasional duplicate ACK can arrive:

      • So to eliminate most of these false loss indications, it is decided that when TCP receives 3 duplicate ACKs (so TCP received a total of 4 identical ACK packets), then TCP concludes that the packet is lossed and TCP retransmits the lossed packet IMMEDIATELY (without waiting for timeout):

        • Having received 3 duplicate ACKs privides a high probability that a packet was lossed, but does not provide certainty...


    • After TCP retransmits the lossed packet, it enters the Slow Start phase (because a packet loss had occured)
    • Time to show TCP congestion control mechanism in action...


  • TCP Tahoe Demo
    • TCP Tahoe (the original version by Jacobson) incorporates the Slow Start and Congestion Avoidance mechanisms.
    • We will look at the operation of TCP Tahoe in this sample network:

    • Here is a NS2 source file to simulate a TCP Tahoe source: click here
      • Right click and save the file in your directory.
      • Run program with:
              export PATH=/usr/local/gnu/gcc/4.1.0/bin:$PATH
              export LD_LIBRARY_PATH=/usr/local/gnu/gcc/4.1.0/lib:$LD_LIBRARY_PATH
        
              /home/cheung/NS/run-ns Tahoe.tcl
        
      • You should see the Network Animator window when it finish running... click PLAY to see the simulation in action
    • You don't need to run the simulation to see the animation... I have saved a copy of the animation file generated by the simulation. The NAM (Network Animation) output file is here: click here

        To see the animation, save the NAM file in your directory and use this command:
            /home/cheung/NS/bin/nam   Tahoe.nam
        
    • The Congestion Window CWND plot data output file is here: click here
        To see the plot of the CWND of TCP, save the Congestion Window CWND plot file in your directory and run gnuplot In gnuplot, issue the command:
             plot "WinFile" using 1:2 title "Flow 1" with lines 1
        
      You should see this plot:
      You can see the operation of TCP Tahoe clearly from the above figure:

      1. At approximately time 0, TCP Tahoe starts and it is in the slow start mode: the congestion window size increases exponentially
      2. At approximately time 5, packet loss is detected. TCP marks SSThresh = 25 (approximately) and begins another slow start
      3. When it reaches CWND = 25 (approximately), the CWND increases linearly - here TCP Tahoe enters the congestion avoidance mode
      4. At approximately time 19, TCP Tahoe detects packet loss and begins a slow start. SSThresHold is approximately 22.
      5. TCP begins another slow start and so on...


    Fast Recovery
  • Added Improvement: Fast Recovery:
    • Fast recovery is a beautiful little improvement made to TCP that signifantly increased the TCP's performance level.
    • Research discovered that:
        Most Fast Retransmit actions occur during mild congestions situation, i.e., congestions that clears up very quickly.
    • Recall that TCP performs a SLOW START after TCP performs Fast Retransmit (because there was a packet loss)
    • Instead of perform a SLOW START (which reduces CWND down to 1 x MSS), research found that TCP can use a larger congestion window without causing network congestion !
    • Fast recovery:
        When TCP performs a fast restransmit (so TCP did not timeout):
        1. set SSThresh = CWND/2
        2. set CWND = SSThresh + 3 * MSS. (The rationel is that 3 duplicate ACK is worth 3 MSS bytes)
        3. TCP continue to use congestion avoidance (but using the new values of of SSThresh and CWND).
    • Example:


  • TCP Reno Demo (Reno implements Fast Recovery)
    • Here is a NS2 source file to simulate a TCP Reno source: click here
      • Right click and save the file in your directory.
      • Run program with:
              export PATH=/usr/local/gnu/gcc/4.1.0/bin:$PATH
              export LD_LIBRARY_PATH=/usr/local/gnu/gcc/4.1.0/lib:$LD_LIBRARY_PATH
        
              /home/cheung/NS/run-ns Reno.tcl
        
      • You should see the Network Animator window when it finish running... click PLAY to see the simulation in action
    • You don't need to run the simulation to see the animation... I have saved a copy of the animation file generated by the simulation. The NAM (Network Animation) output file is here: click here

        To see the animation, save the NAM file in your directory and use this command:
            /home/cheung/NS/bin/nam   Reno.nam
        
    • The Congestion Window CWND plot data output file is here: click here
        To see the plot of the CWND of TCP, save the Congestion Window CWND plot file in your directory and run gnuplot In gnuplot, issue the command:
             plot "Reno-Window" using 1:2 title "Flow 1" with lines 1
        
      You should see this plot:
        You can see that this small change in TCP Reno has resulted in a huge performance improvement:

        1. Again, at time 20, TCP Reno is in congestion avoidance mode
        2. At approximately time 27, TCP Reno detects packet loss and performs a fast retransmit and the fast recovery was successful. TCP Reno continues in the congestion avoidance mode without performing a slow start (We can see this because CWND did not start with 1)
        3. Again, at approximately time 40, TCP Reno detects packet loss and performs a fast retransmit and the fast recovery was successful. TCP Reno continues in the congestion avoidance mode without performing a slow start (We can see this because CWND did not start with 1)


  • Further TCP Research: the TCP Flow Synchronization problem
    • Do NOT think that this is the end of the story about Congestion Control on the Internet !
    • This material on TCP is only the tip of the iceberg... There are much more problems and issues with TCP after they introduced TCP Reno
    • For example, research has discovered that different TCP flows sharing a bottle neck link will synchronize with each other !!! (Here is a paper that points out the phenomenon: click here )
      Example that illustrates TCP synchronization:

      • Source 1 (red) start transmitting at time 0.1 sec
      • Source 2 (blue) start transmitting at time 20.0 sec

    • Here is a NS2 source file to simulate 2 TCP Reno sources sharing the bottle neck link: click here
      • Right click and save the file in your directory.
      • Run program with:
              /home/cheung/NS/run-ns Reno.tcl
        
      • You should see the Network Animator window when it finish running... click PLAY to see the simulation in action
    • You need to run the simulation to see the animation because I deleted the animation file generated by the simulation.
    • The Congestion Window CWND plot data output files are here:
      To see the plot of the CWND of TCP, save the Congestion Window CWND plot file in your directory and run gnuplot
      In gnuplot, issue the command:
           plot "WinFile" using 1:2 title "Flow 1" with lines 1, \
                "WinFile2" using 1:2 title "Flow 2" with lines 2
      
      
      You should see this plot:
    • The plots shows clearly that:
      • Flow 1 starts early
      • Flow 2 starts later and cause packet drops for both flows
      • The 2 TCP flows perform Slow Start together and reduce their windows simultaneously
      • Eventually, the congestion windows of both flows are synchronized !!!
      This kind of behavior is not good, because the best way to utilizate all network capacity is for one of the flow to cut back
      (But it should NOT always be the same flow, otherwise you have unfairness)


    • The research to solve this phenomenon triggered the development of "Active Queue Management (AQM)" - among them, the "Random Early Drop/Detection (RED)" queue is the best well-known representative.


  • Further TCP Research: RTT unfairness problem
    • TCP is NOT fair when different TCP connection share a bottle neck link but have different Round Trip Times (RTT)
    • Example that illustrates TCP unfairness when RTTs differ:

      • Source 1 (red) start transmitting at time 0.1 sec, RTT is 2 x 150 msec
      • Source 2 (blue) start transmitting at time 20.0 sec, RTT is 2 x 640 msec
      • Due to higher RTT, the CWND of flow 2 will increase slower !!!

    • Here is a NS2 source file to simulate 2 TCP Reno sources sharing the bottle neck link: click here
      • Right click and save the file in your directory.
      • Run program with:
              /home/cheung/NS/run-ns Reno.tcl
        
      • You should see the Network Animator window when it finish running... click PLAY to see the simulation in action (The NAM file is too big and I deleted it...)
    • The Congestion Window CWND plot data output files are here:
      To see the plot of the CWND of TCP, save the Congestion Window CWND plot file in your directory and run gnuplot
      In gnuplot, issue the command:
           plot "WinFile" using 1:2 title "Flow 1" with lines 1, \
                "WinFile2" using 1:2 title "Flow 2" with lines 2
      
      
      You should see this plot:

      • You can see that the average congestion window size of flow 2 is lower than flow 1 and they do not converge...
      • BTW, you can also see the TCP flow synchronization problem in this plot:
          Both flows will often perform slow start at (approximately) the same time


  • Further TCP Research: Gigabit networks
    • Another area of intense research is to adapt TCP for higher speed networks (Giga or Tera bit networks). In these networks, the usable window size is huge... hundreds of thousands of packets.
      TCP cannot afford the luxury to increase its window size by 1 in each RTT.
      In order to reach the fill capacity of the network, TCP must increase faster...
    • Example that illustrates TCP's behavior in high speed network :

      • Source start transmitting at time 0.1 sec

    • Here is a NS2 source file to simulate TCP Reno on a high speed (Giga bit) network: click here
      • Right click and save the file in your directory.
      • Run program with:
              /home/cheung/NS/run-ns Reno.tcl
        
      • You should see the Network Animator window when it finish running... click PLAY to see the simulation in action (The NAM file is too big and I deleted it...)
    • The Congestion Window CWND plot data output files are here:
      To see the plot of the CWND of TCP, save the Congestion Window CWND plot file in your directory and run gnuplot
      In gnuplot, issue the command:
           plot "WinFile" using 1:2 title "Flow 1" with lines 1
      
      
      You should see this plot:

      • You can see that TCP performed 2 unsuccessful slow starts
      • At approximately 16 sec, TCP performs the 3rd slow start.
      • This slow start terminates at approximately 18 sec.
      • Then TCP performs Congestion Avoidance... all the way up from CWND = 20 (approximately) to 250+ The simulated ended after 140 sec and TCP has not reached full capacity yet !!!
    • If TCP wants to take advantage of high speed links, it must increase the congestion window more aggressively and additively